Parameter graph
In most cases, parameters are set numerically by a straight or curved graph as follows:
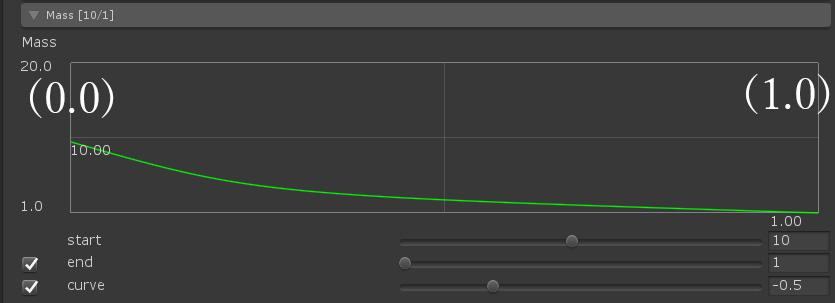
This graph shows fixed particles as 0.0 (start point: left) and moving particles as 1.0 (end point: right).
This horizontal axis is called the particle depth.
The start point and end point can be confirmed in the scene view by turning on the depth of the cloth monitor.
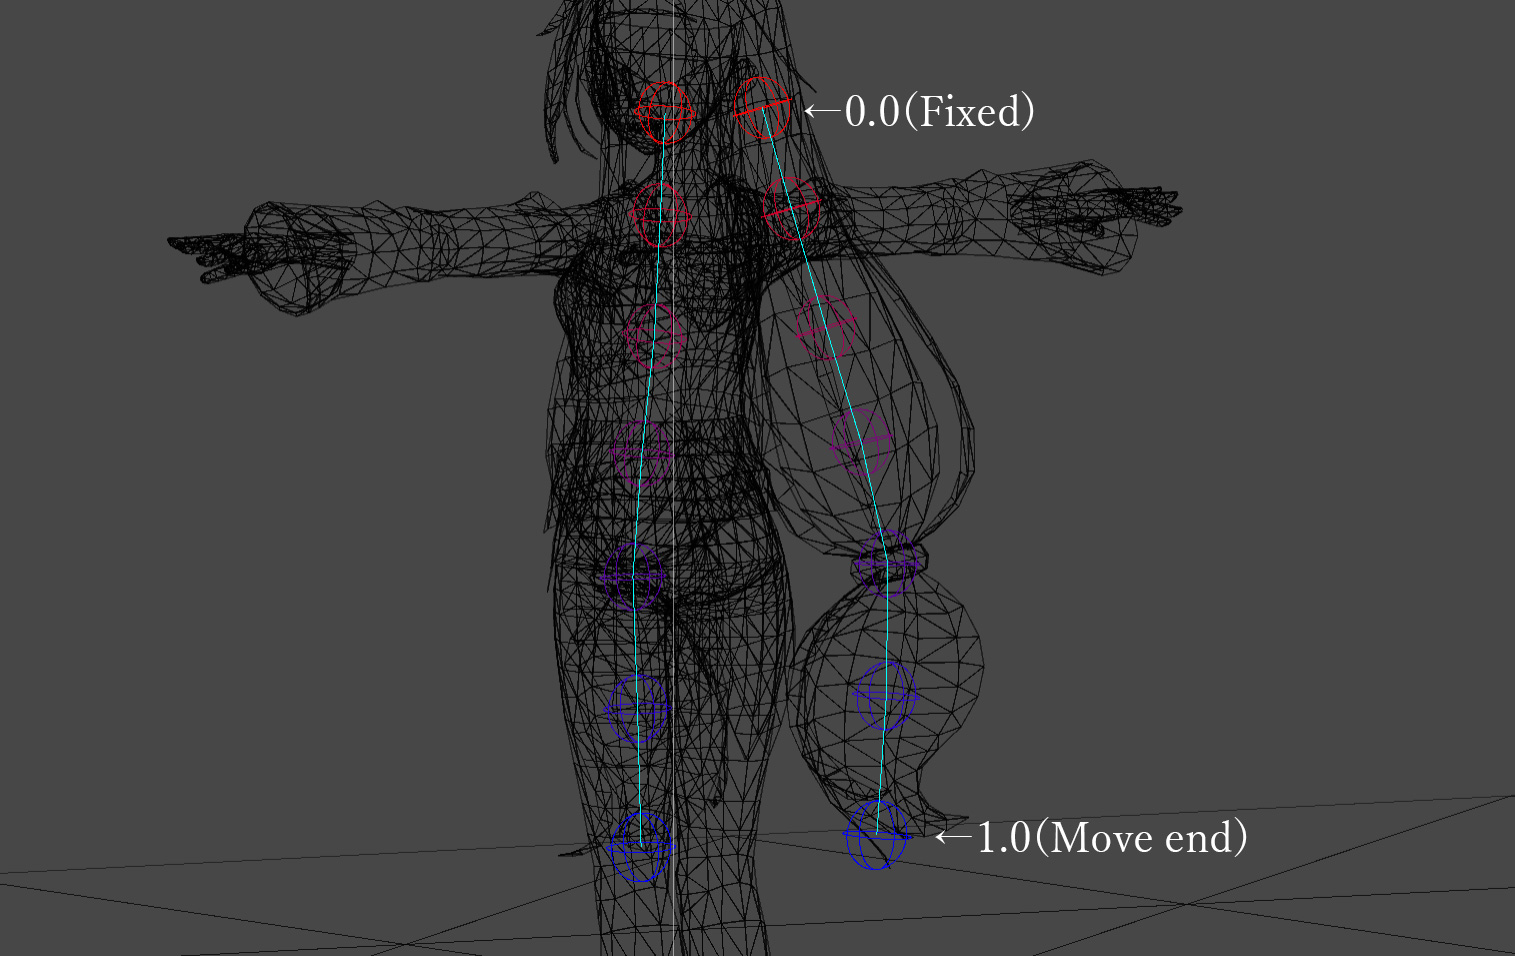
This makes it possible to set different values for the start and end points for each parameter.
The depth between them is interpolated by the start and end points and the value of the curve.
The basic chart properties are as follows:
| Name | Description |
| start | Set a value of depth 0.0. |
| end | Set a numerical value with a depth of 1.0. When the check is turned off, the end value is ignored, and the start value is used as the end value. |
| curve |
Set the strength of the curve. |
Parameter On / Off
Some parameter panels can be checked.
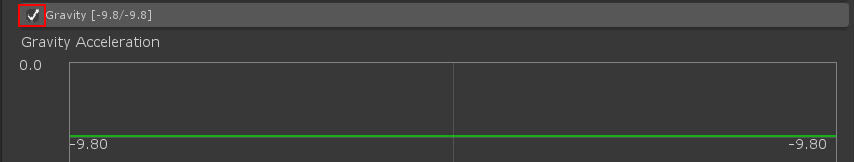
By turning on / off the check of such a parameter, the operation of the parameter itself can be turned on / off.
Data creation warning
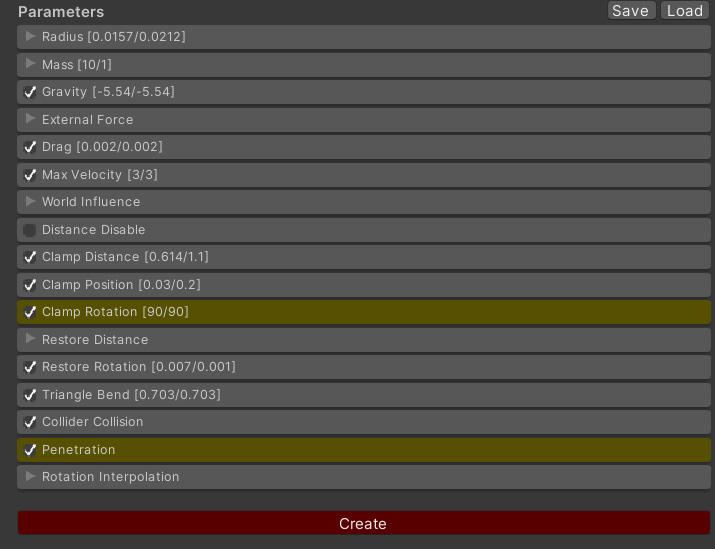
Some parameters will not be reflected unless you click the [Create] button after setting and create the data.
If you correct such parameters, the panel color will change to yellow as shown in the image and warn you.